Google Search Console is a free and easy tool to conduct a full SEO audit for you or your clients’ website. I’ll show you exactly how to do this in my step by step guide.
Google Search Console is a highly underutilized and underrated tool that will help improve your site’s performance in Google’s organic search. It allows you to audit your website’s technical, on-page, and off-page SEO, which makes it a very robust tool.
In this step by step guide, I will show you how to conduct a complete SEO audit of your site using Google Search Console only.
Here is a summary of the steps that we are going to cover:
- XML Sitemap Confirmation
- Check Your Site’s Index Coverage
- Check Your Site’s Crawl Health
- Check Your Site’s On-Page Performance
- Check Your Site’s Page Experience
- Check Your Site’s Structured Data
- Check For Security Issues & Manual Penalties
- Check Your Site’s Backlinks & Internal Linking
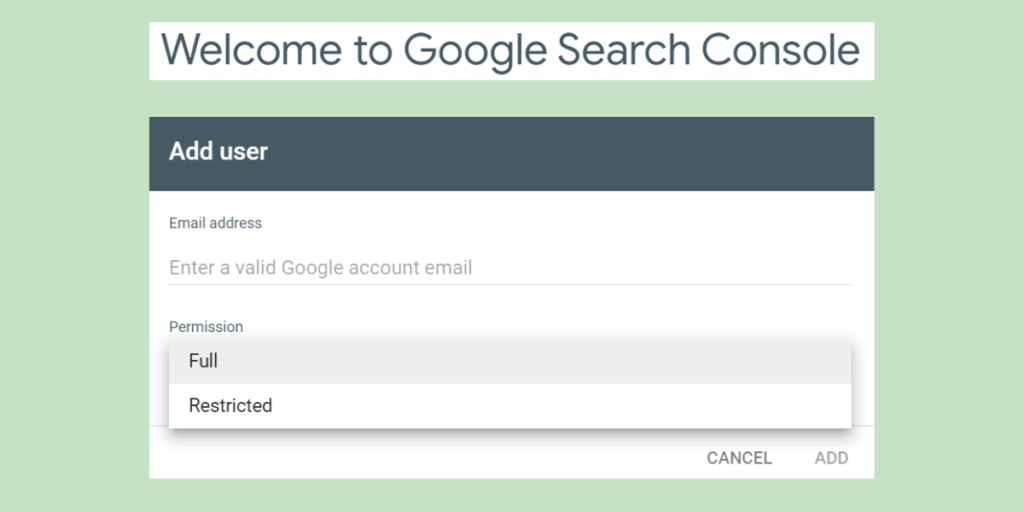
Have you hired someone to perform SEO work on your website? If so, make sure you have properly added them to your Google Search Console property so that either one of you don’t run into any issues.
1. XML Sitemap Confirmation
The first step of the audit is simple, but important. You are going to check that your site has an XML sitemap submitted to Google.
An XML sitemap will help Google discover your site quicker, help improve crawl efficiency, and will give hints as to what pages should be include in it’s search engine index.
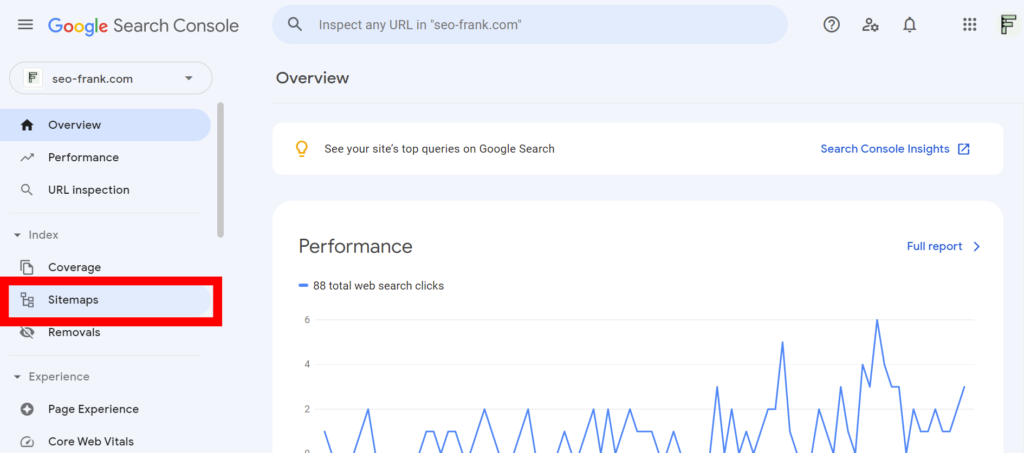
To check for this, click “Sitemaps” located underneath the “Index” tab of Google Search Console’s main navigation menu on the left hand side.
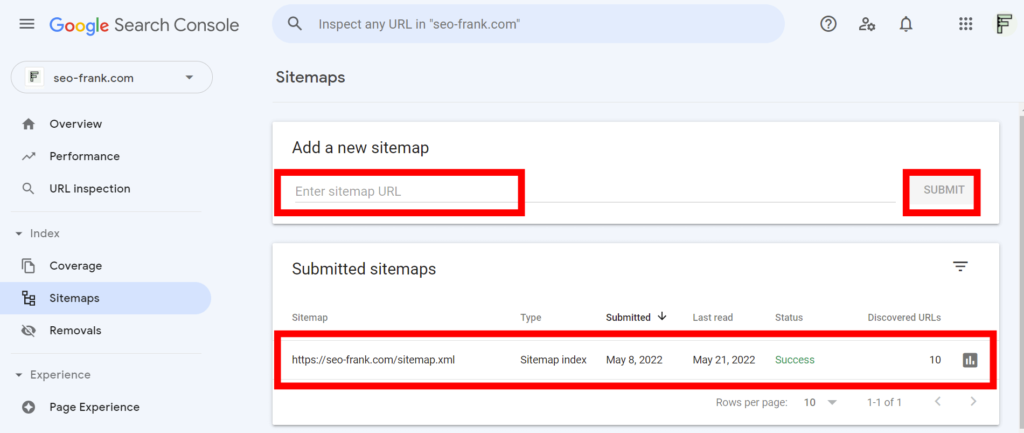
If your site has an XML sitemap submitted to Google, it will be listed in the “Submitted sitemaps” section.
Check for the following items within the “Submitted sitemaps” report:
- Ensure at least one XML sitemap has been submitted through the tool.
- Make note of the submitted date, as well as the date last read. The date last read should be something fairly recent.
- Make sure that the submitted sitemap reads “Success” in green underneath the status column.
- If it does not read “Success”, there may be something wrong with the sitemap that was submitted, and you will have to look into this.
- If your site doesn’t have an XML sitemap submitted, enter the URL of your sitemap into the “Add a new sitemap” section at the top, and click “Submit”.
Not sure where to find the URL of your XML sitemap?
Try entering the following into your browser’s search bar, to see if your XML sitemap appears:
- Your domain name followed by “/sitemap.xml”. For example, for my site I would try “https://seo-frank.com/sitemap.xml”. This is where my XML sitemap is currently located.
- If the above does not work, try “/sitemap_index.xml”. I would try “https://seo-frank.com/sitemap_index.xml” for this option.
If the above checks don’t work for you, you will have to check within your content management system for the location of your XML sitemap.
Use Google’s XML sitemap management for troubleshooting any issues that you may encounter with the submission of your XML sitemap in Google Search Console.
Now that you know how to check for and submit an XML sitemap to Google, let’s move on to the next step.
2. Check Your Site’s Index Coverage
In this step you are going to check your site’s index coverage. This consists of:
- Ensuring all your site’s important pages have been indexed by Google.
- Checking for any indexed pages that you may want to remove. This would apply to pages that don’t provide any value to your users.
To check your site’s index coverage, click on “Coverage” underneath the “Index” tab in Google Search Console.
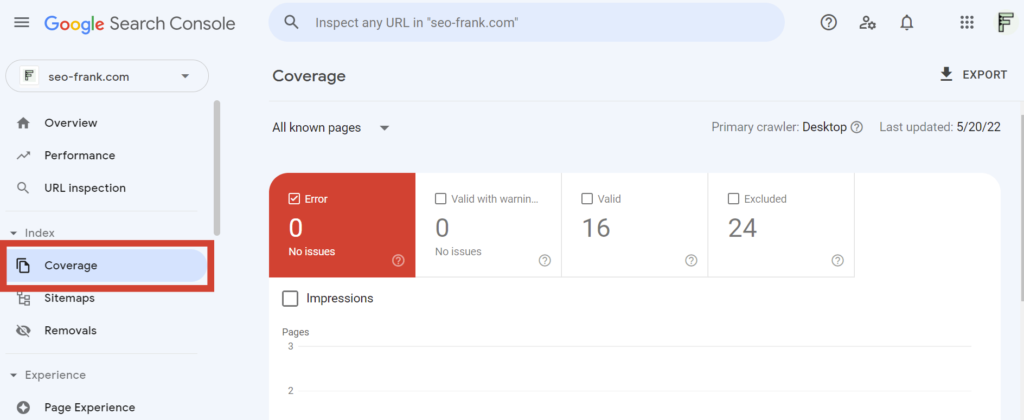
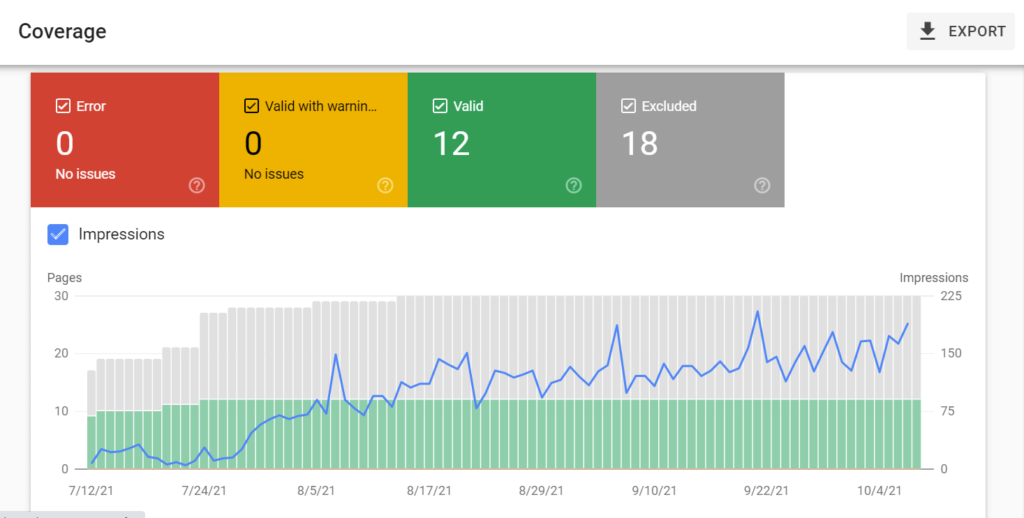
Select the “Error”, “Valid with warnings”, “Valid”, and “Excluded” boxes at the top of the report to show these items in the graph over time. You can even select the impressions box to display this metric in the graph as well.
This is a very important report, so make sure you get familiar with it. You want to make sure you are checking this report often.
Scroll down to see the details section. This will show you the type of error, warning, valid, or excluded detail associated with each item.
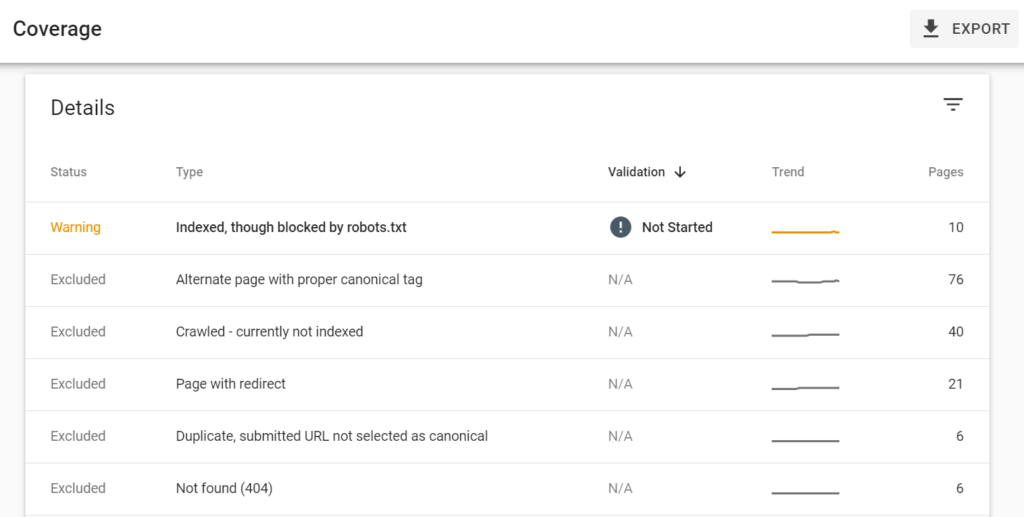
If you have any errors listed in the report, this is where you will want to start.
Index Coverage Errors
To begin diagnosing and fixing any index coverage errors that you encounter in the report, use the following workflow:
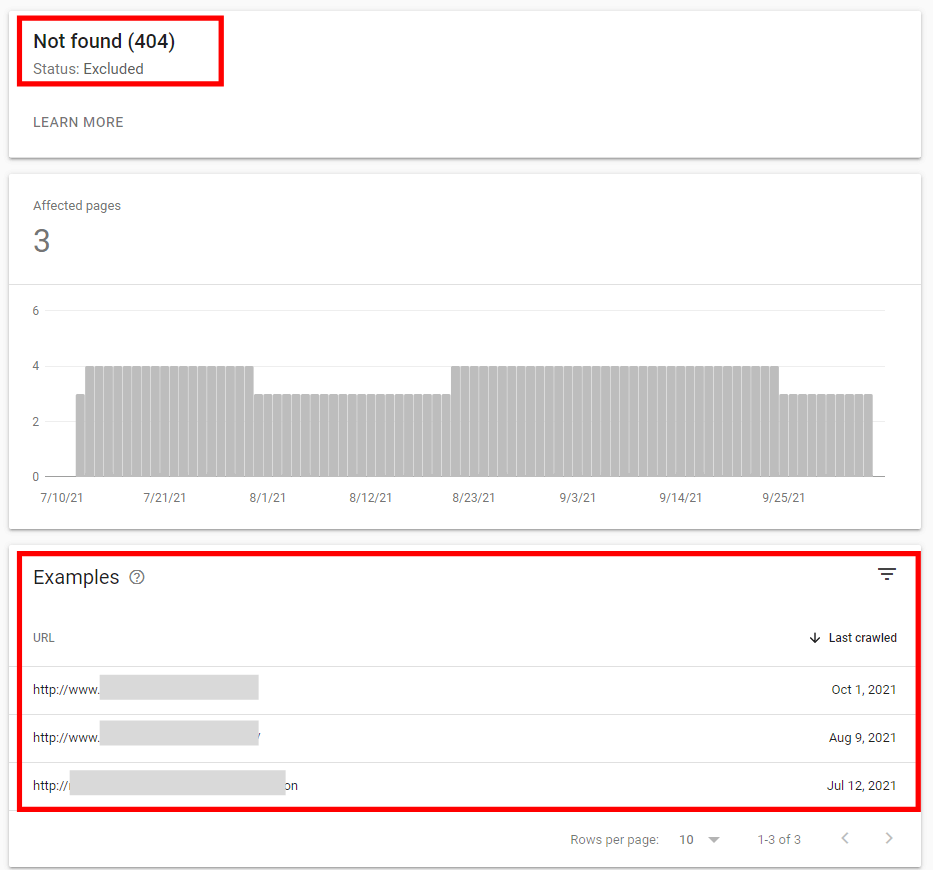
- Click on the specific error type listed in the details table. The report will then show you examples of all the pages on your site that are associated with that specific error type. In the case below, I have found some pages that have 404 errors that I am going to have to deal with.
- If you are unsure what the specific error is referring to, or how to fix it, consult Google’s index coverage report help document. The document lists the common errors found, and provides help as to how you can fix them.
- Once you figure out the issue and the associated fix, you will have to go through and fix each page in the list one at a time. Therefore, make sure to prioritize your most important pages.
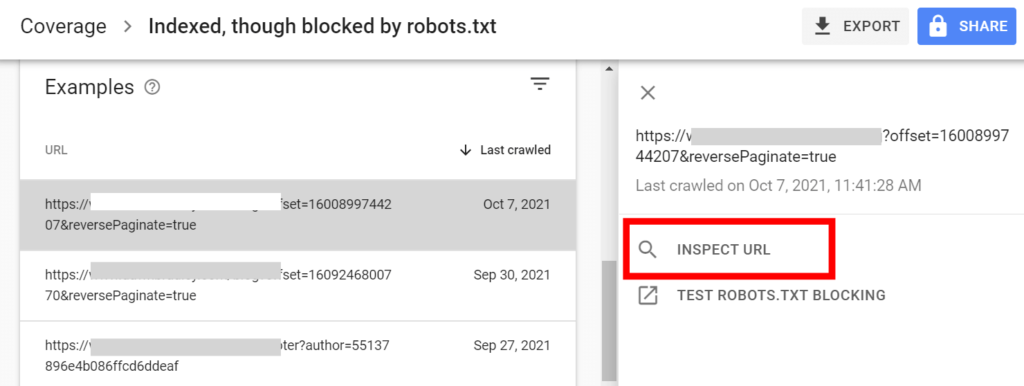
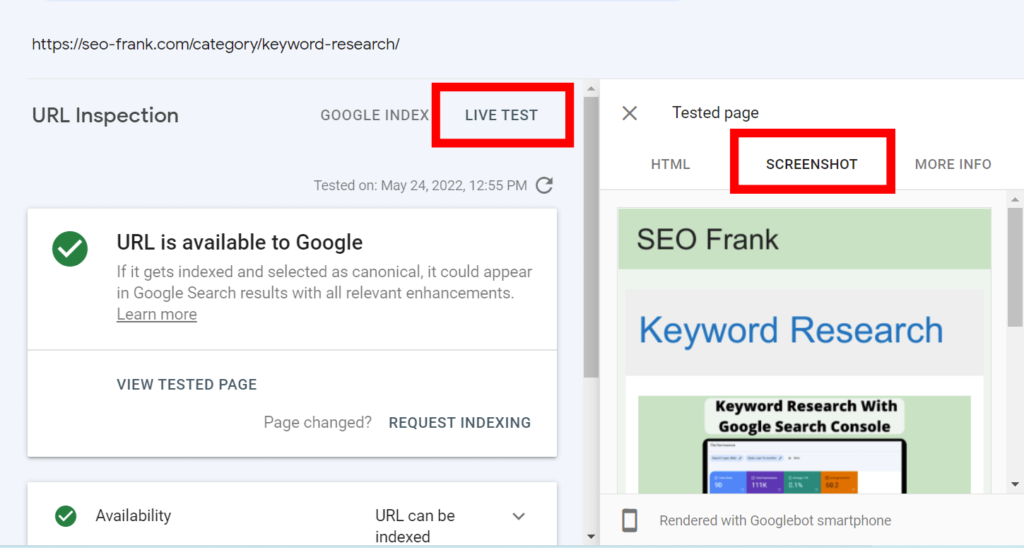
- Use Google Search Console’s URL inspection tool if you are still unsure what may be causing the error. Click on the specific page shown in the examples section and then click “Inspect URL”.
- After Google Search Console inspects the URL, you can click on “Test Live URL” in order to see how Google is currently crawling and rendering the live page.
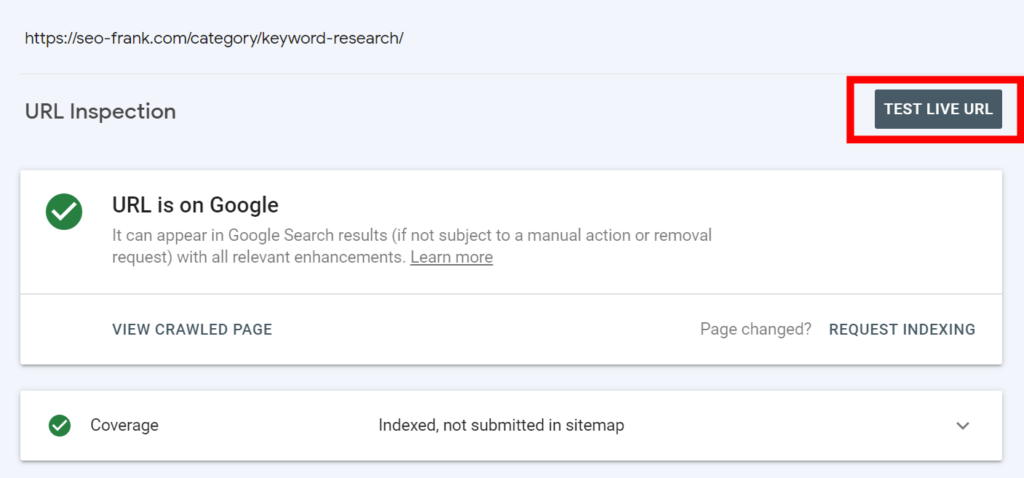
- Click on “View Tested Page” to view a screenshot of the page which will show you if Google is seeing the page correctly. This will help give you additional insight into what may be causing the indexation error.
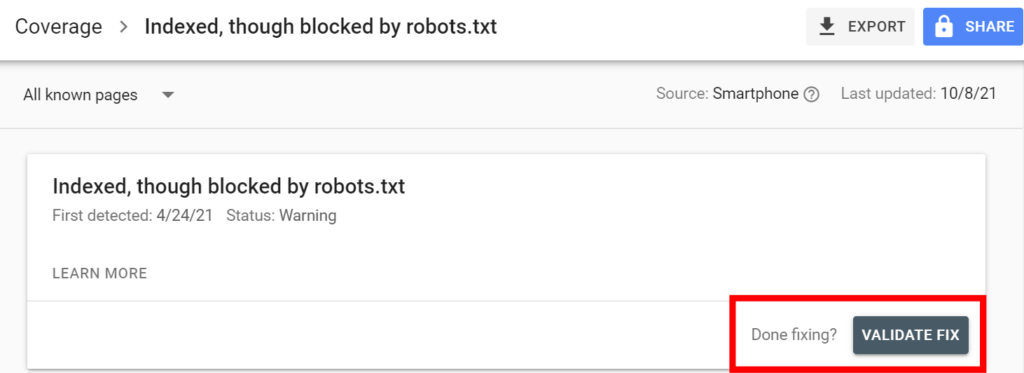
Once you are able to fix any errors, make sure to validate the fix using the “validate” button at the top of the report. Google will then let you know if the problem was successfully fixed in a day or two.
Once you have completed going through all the indexation errors, move on to any warnings shown in the report.
Index Coverage Warnings
Next, check for any warnings listed in the details section of your index coverage report.
Keep in mind that not all warnings require a fix. Sometimes, just being aware of certain warnings and ensuring that you are ok with them, is good enough.
Use the same workflow that we covered above in the errors section for diagnosing and fixing any warnings in your index coverage report.
Next, let’s move on to the “valid” items in the report.
Index Coverage: Valid Pages
Once again, use the details section of your index coverage report to look for any valid items listed.
Valid items are usually a good thing, as they are telling you that pages in these groups have been successfully indexed by Google.

In the case of my website, the valid pages have been split into into 2 category types:
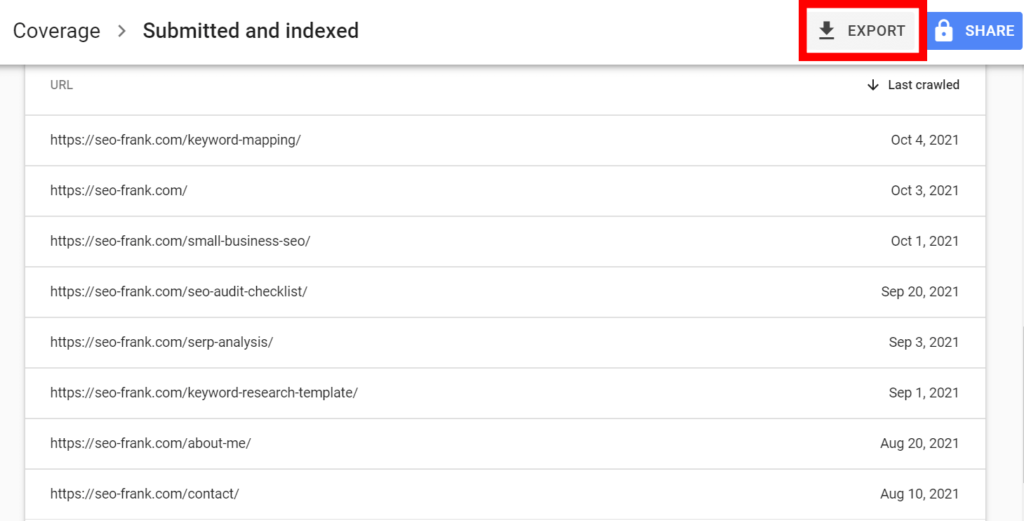
- Submitted and indexed: these are the pages that were included and submitted in my XML sitemap, and have been indexed by Google.
- Indexed, not submitted in sitemap: these are pages that were not included and submitted in my XML sitemap, but have still been indexed by Google.
First, deal with any submitted and indexed status types. Check for the following:
- Compare the list of submitted and indexed pages in your report against a list of pages from your content management system. If you have a fairly small site, you can probably accomplish this manually. In the case of a larger site, you may want to export your submitted and indexed pages from Google Search Console as a Google Sheet or Excel File, and then do the comparison there.
- Try to find any gaps between the 2 lists.
- If there are any important pages in your content management system that are missing from the submitted and indexed list, you will need to find out why, and try to get those pages indexed.
If you have important pages that aren’t being indexed, start with the URL inspection tool in Google Search Console that we talked about briefly above.
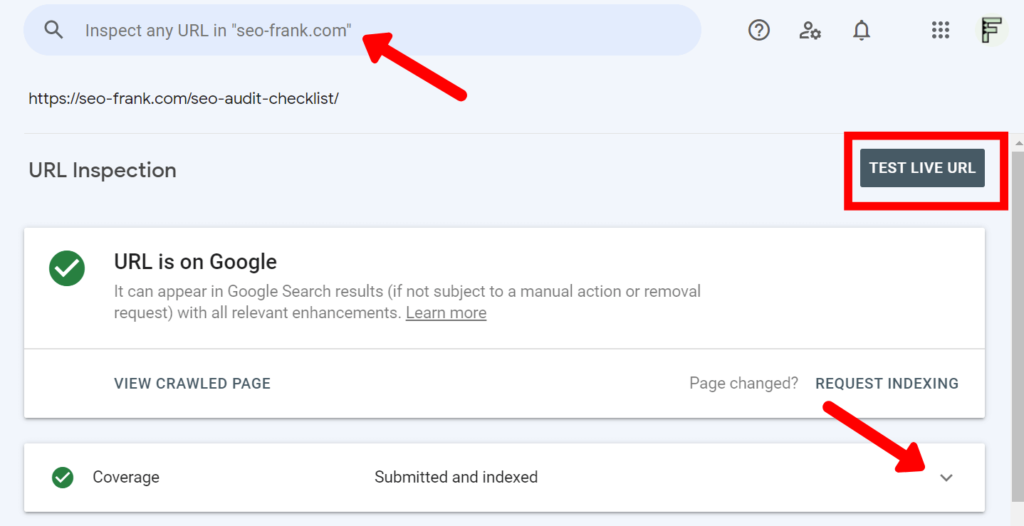
Type the missing URL(s) into the tool, which is located at the top of the Google Search Console interface.
The report generated by the tool will give you a lot of valuable information for that specific page.
Expand the “Coverage” section to get more details. Click “Test Live URL” to show you how Google is crawling and rendering the live version of the page, as discussed earlier.
Next, deal with any indexed, not submitted in sitemap status types.
Here you are checking for pages indexed by Google that you don’t actually want in the index.
What should you do if you find pages here that you want to remove from Google’s index?
I suggest, adding the meta robots noindex tag to the HTML of these specific pages. This will tell Google not to index these pages.
However, Google won’t de-index these pages until the next scheduled crawl, so depending on your site, this could take a bit of time.
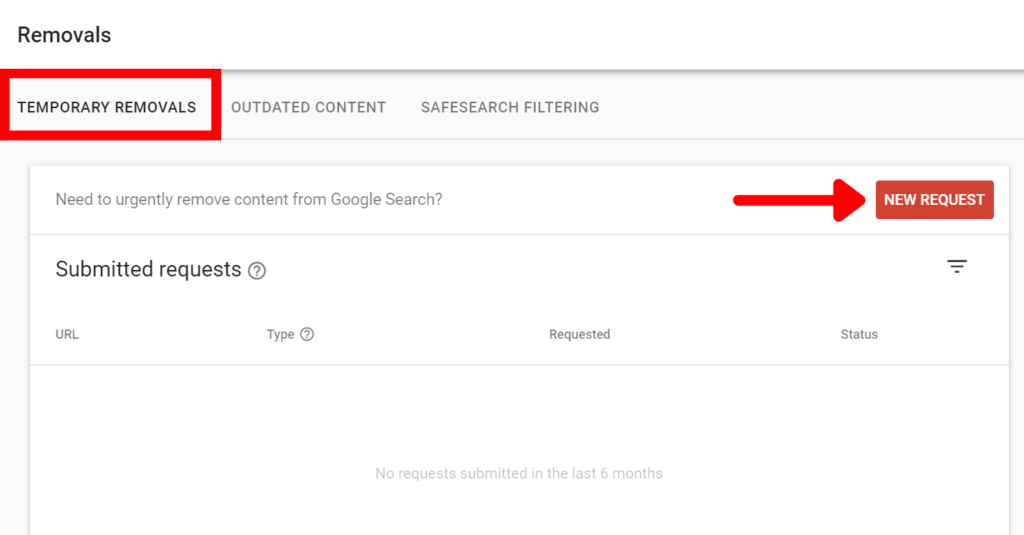
For a quicker removal fix, use Google Search Console’s URL removal tool. To access the tool, click on “Removals” within the “Index” tab in Google Search Console.
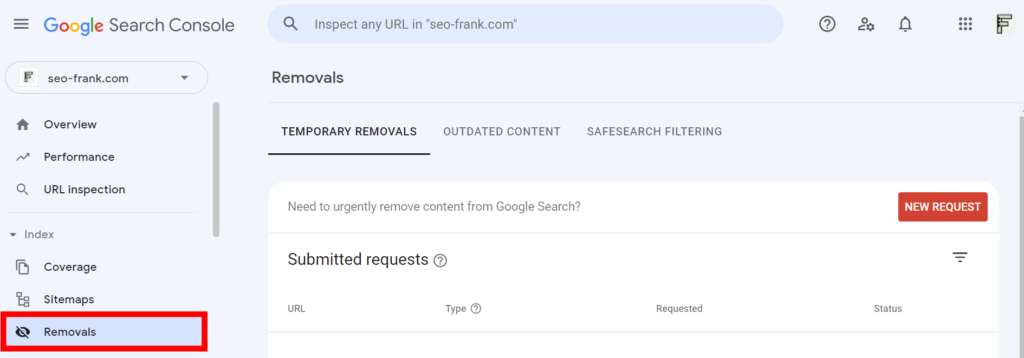
Click on “New Request” and enter any pages that you want to be removed immediately from Google’s index. Keep in mind that this removal will only be implemented for 6 months. Therefore, if you want the removal to become permanent, make sure to also add the meta robots noindex directive to these pages, as mentioned above.
Lastly, check for any “excluded” items in your index coverage report.
Index Coverage: Excluded Pages
Excluded items listed in your index coverage report show pages that are currently being excluded from Google’s index.
Keep in mind that you don’t want all your pages indexed by Google, so you are going to most certainly see some pages listed in this category.
The main thing is to be aware of any excluded pages and ensure that you are ok with this.
Typically, you should be ok with Google excluding the following types of pages:
- Pages with thin content that don’t provide any value to your user’s in search.
- Login pages that only serve a small amount of users from your team (non-public logins).
- Thank you pages.
- Checkout pages.
- Pages with URL parameters or paginated pages.
Follow the same workflow that we covered in the errors section above to diagnose and fix pages that you want to get included in Google’s index.
Now that you have audited your site’s index coverage using Google Search Console’s index coverage report, it’s time to look at another technical element that can affect the SEO of your site: how Google is crawling your site.
3. Check Your Site’s Crawl Health
In this step you are going to check the crawl health of your site using Google Search Console’s crawl stats report.
If Google is having issues accessing and crawling your site, this can negatively impact your site’s SEO.
If you have a site that is less than a few thousand pages, chances are you won’t need to worry about crawling issues. However, I still recommend reviewing how Google is crawling your site from time to time to see if there are any issues.
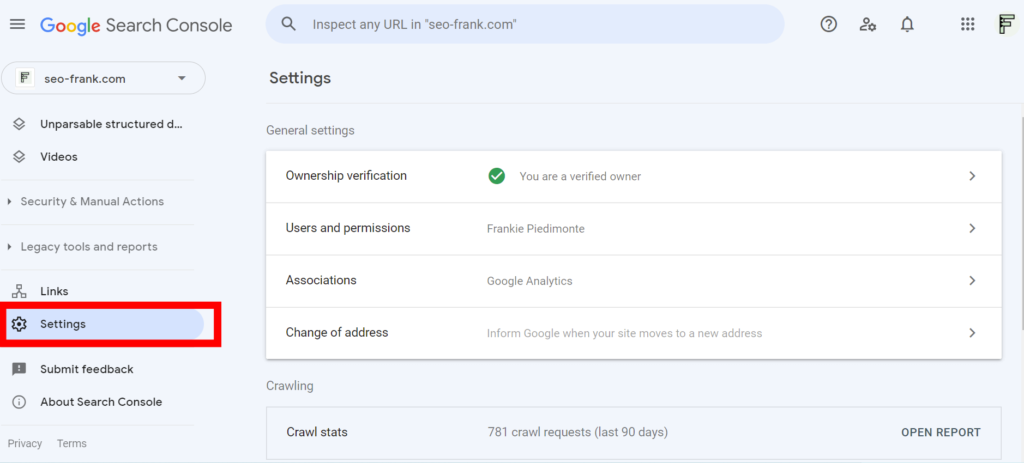
To check your site’s crawl stats report, click “Settings” near the bottom of the Google Search Console menu. Then click “Open Report” in the “Crawling” section.
This report will show you useful information about how Google is crawling your site.
Select the “total crawl requests”, “total download size” and “average response time” boxes to see these metrics displayed over time in the graph.
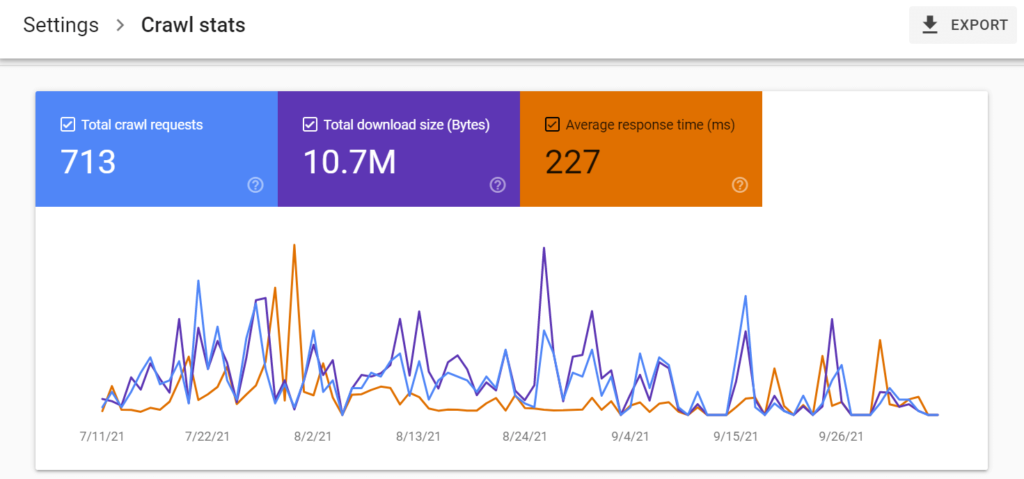
Check for the following:
- What is the trend for the total crawl requests and total download size? Are they increasing, or decreasing? Are there any spikes? Ideally, you want these to be increasing over time, even if it is a slow increase. This shows that Google is spending time crawling your site more and more over time, which is a good thing.
- Are there increases, spikes, or dips in the average server response time? Any spikes can indicate that your server is being overloaded. If this is happening often, or your response time is high and continuing to increase, it may be an indication that you need to consider increasing your server’s bandwidth, or moving to a better host.
Next, scroll down to the “Hosts” section. If you have a domain property set-up with Google Search Console and have any subdomains on your site, your site will be split into various hosts.
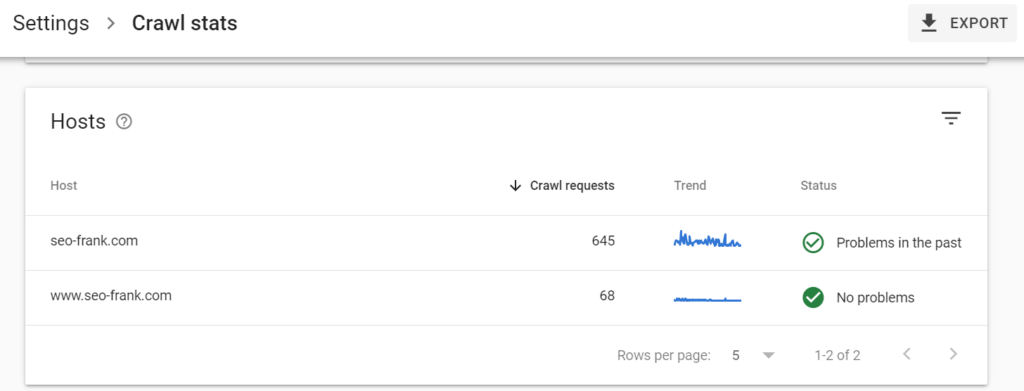
Click on your main host listed to view the crawl stats for that host only.
In the case of my website, I should be mainly concerned with “seo-frank.com”, as the www sub-domain redirects to the naked domain.
Once you click on your main host, scroll down a bit and click on “Host Status”.
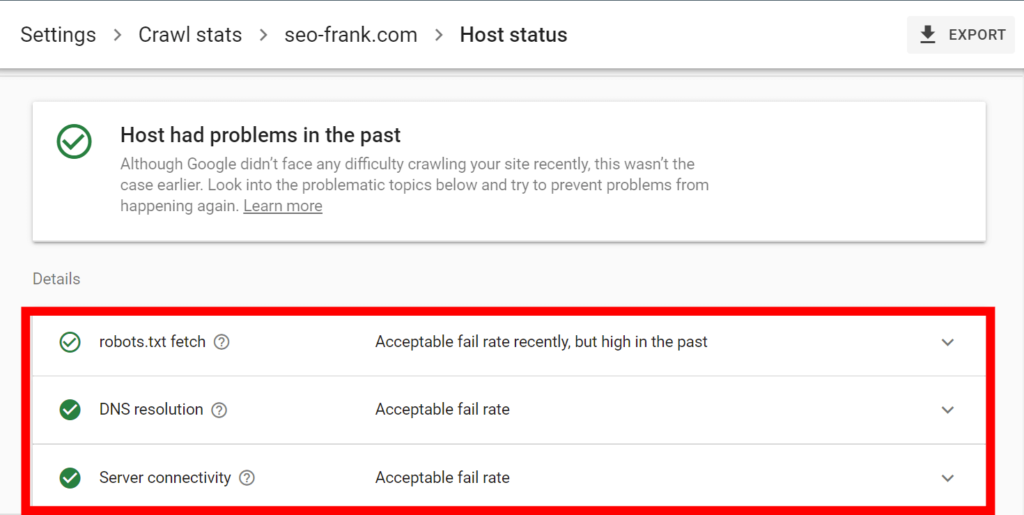
This report will show past problems Google has had accessing your site. In the details section you will see the report broken down into:
- robots.txt fetch: this section shows failed requests for your site’s robots.txt file over time. If your server is having issues providing the robots.txt file to Google regularly, this is not a good sign. Googlebot will slowly reduce and may even stop crawling your site if this happens frequently. Keep in mind that your site does not need a robots.txt file as long as status codes of 404 or 410 are being returned to Google.
- DNS resolution: this section shows you any DNS lookup issues for your site. If you notice frequent errors with your site’s DNS resolution over time, you will need to look into this. This may mean that the DNS settings with your hosting or domain registrar may not be configured correctly.
- Server connectivity: this section shows you errors that Google has had connecting with your server. If you see lots of past problems here check to see if your site is returning any 500 status codes (server errors). This could mean an overloaded server, or one of many other potential errors with your server.
The last report you want to check with regards to the crawl health of your site is the crawl requests breakdown section.
Go back to your main crawl stats report and scroll down to the “Crawl requests breakdown” section.
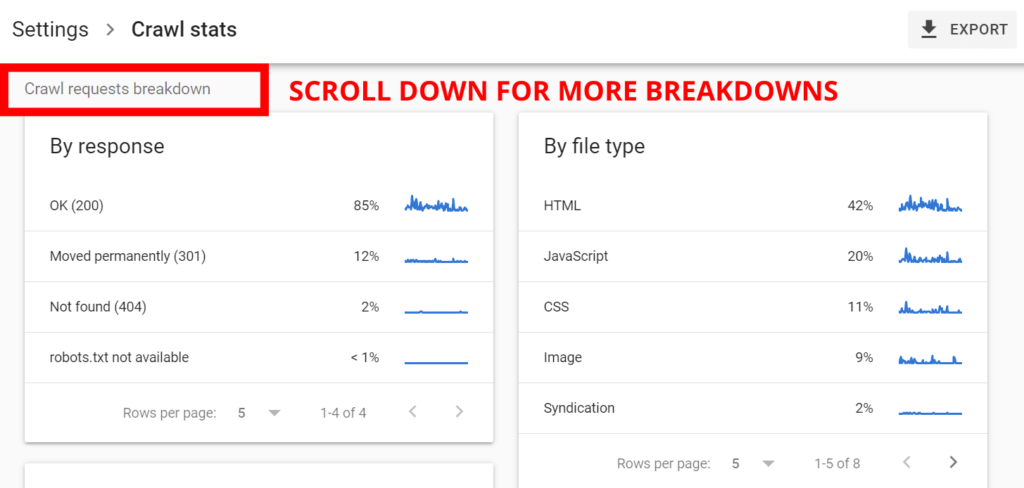
This report will break down Googlebot crawl requests by:
- Response: Make sure that the majority of the response codes sent to Google are “OK (200)”. If you have a high percentage of 3xx, 4xx, or 5xx codes, you should do an audit of these on your site. Use a web crawling tool like Screaming Frog.
- File Type: The majority of file types requested by Google should be HTML. If you have lots of JavaScript or CSS being requested by Google, it may be a sign that your site is heavy with scripts and styles. This can cause issues with Googlebot’s crawl speed and budget, as well as a slow page load speed for your users.
- Purpose: This will show crawl requests that were made as a refresh (re-crawl of an existing page already known to Google), as well as discovery (crawling a new or unknown page to Google). The majority of these requests should be refresh, unless your site is new, or you are generating a lot of new content.
- Googlebot Type: This will show crawl requests based on the specific Googlebot type.
If you need any additional information or insights into items related to your site’s crawl stats in Google Search Console, check out Google’s Crawl Stats Report guide.
Now that you have audited your site for technical SEO issues with Google Search Console, let’s move on to some on-page checks.
4. Check Your Site’s On-Page Performance
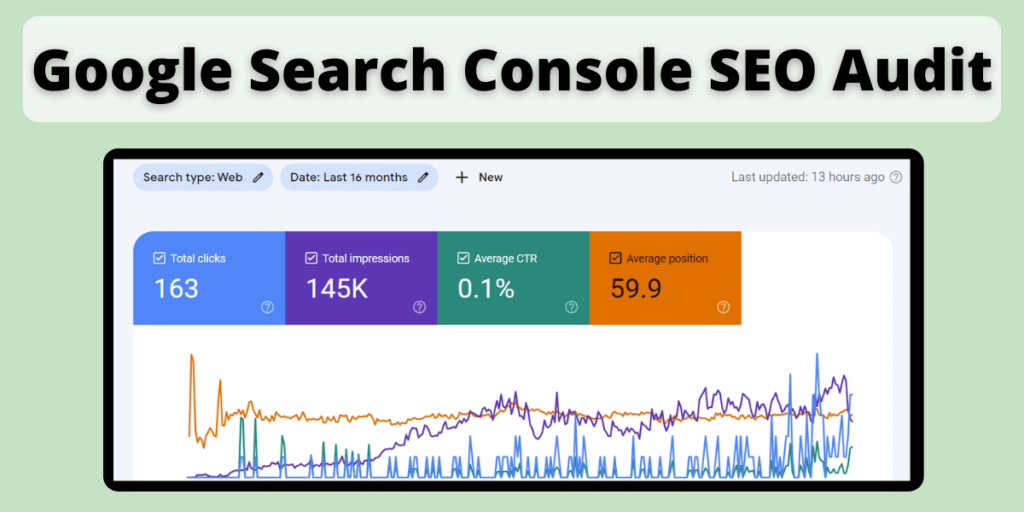
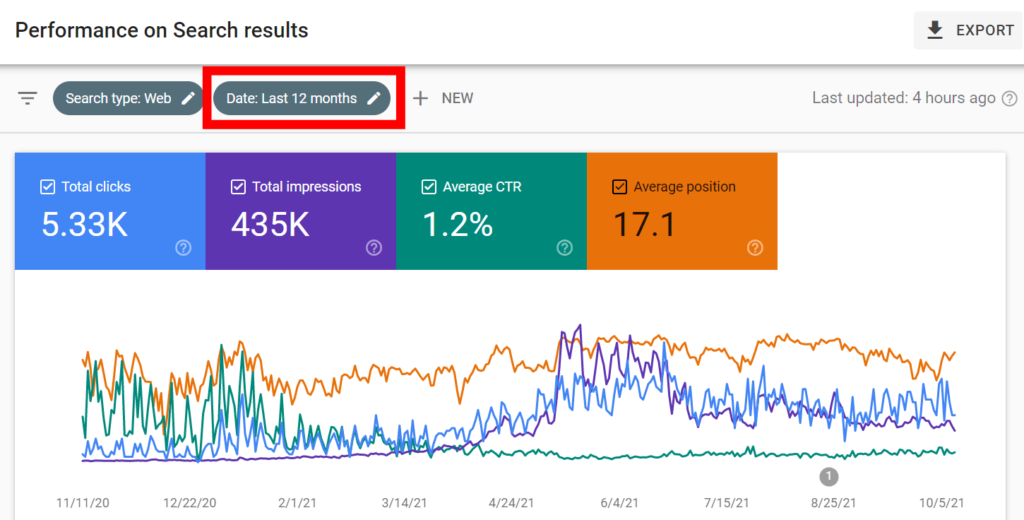
One of the best ways to improve your site’s performance in organic search, is with Google Search Console’s performance report.
To access this report, click on “Performance” in the menu.
This is another important report in Google Search Console that you should familiarize yourself with and check often.
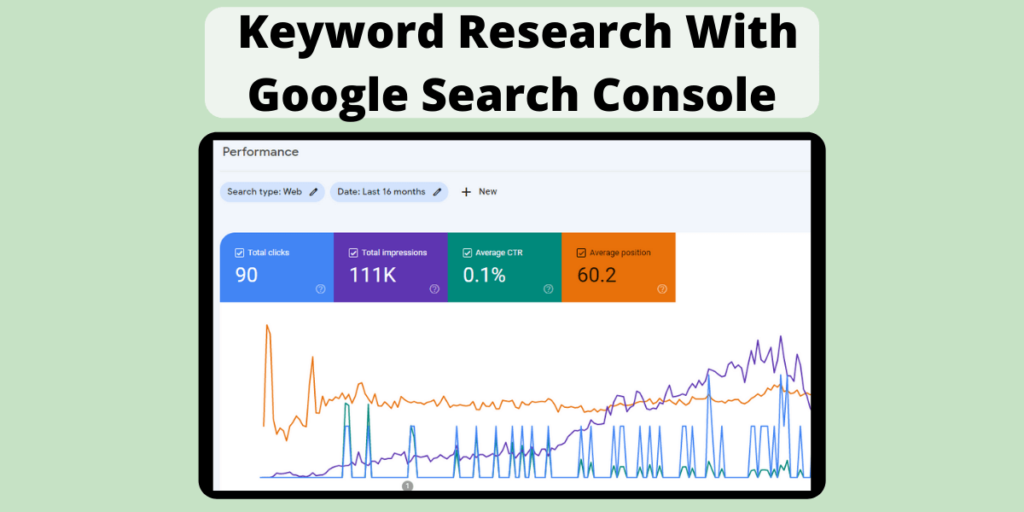
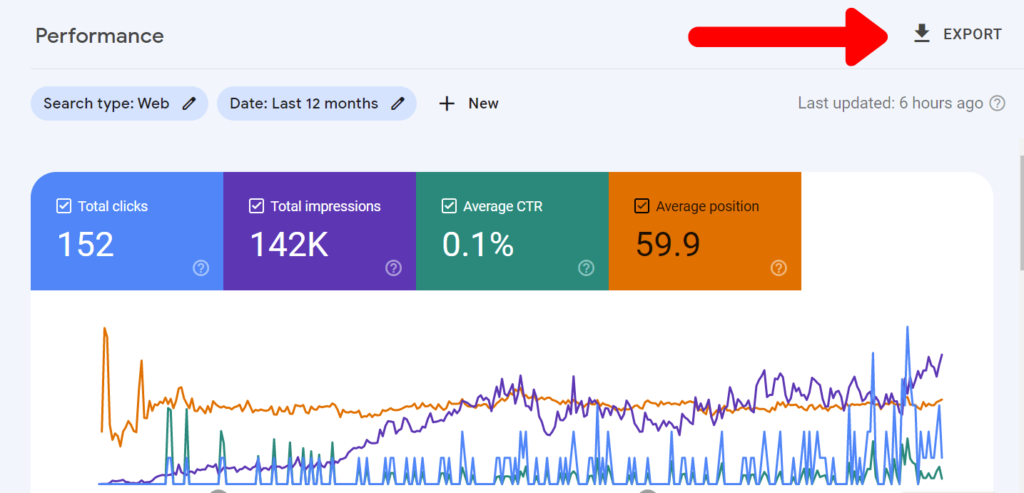
The performance report will show your site’s performance in Google in terms of total clicks, impressions, average CTR and average ranking position. I recommend selecting at least the last 12 months of data at the top of the report.
In order to analyze the data, I recommend exporting this entire report as a Google Sheet, Excel File, or CSV file using the “Export” button located at the top right of the report. I find it is easier to filter and work with the data in a spreadsheet, as opposed to directly in Google Search Console.
The first thing you want to do with the report after you have exported it to a spreadsheet is find your site’s existing ranking keywords in Google.
Find Your Site’s Existing Ranking Keywords
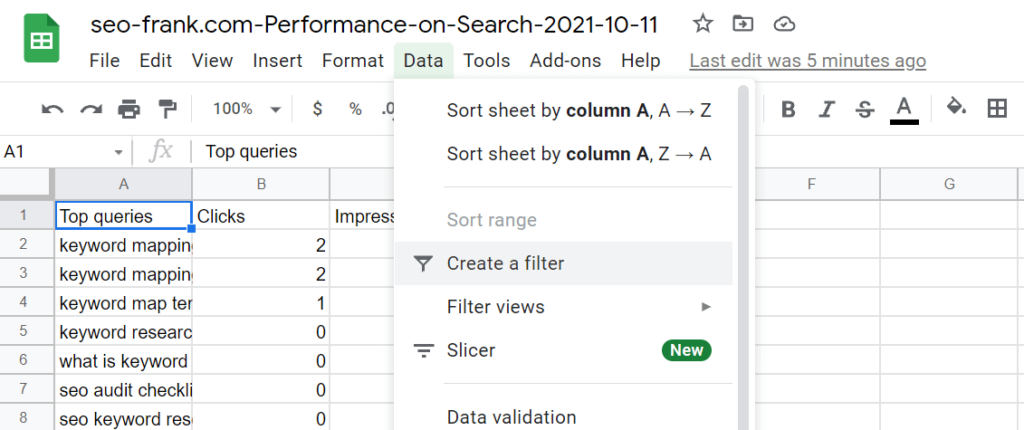
To find your site’s existing ranking keywords, use the “Queries” tab in your exported spreadsheet. This tab shows all the keywords that Google is currently ranking your site for in organic search along with the associated clicks, impressions, average CTR, and average ranking position for each.
In order to easily filter through the data, create a filter for the table. Highlight all the data in the table, then click “Create a filter” under the “Data” column.
Next, find the keywords that you are ranking for on the first page of Google (positions 1 through 10).
- Filter the average position column to values 1 through 10.
- Go through the list and highlight all the keywords that are highly relevant to your site.
- Sort the relevant keywords you selected by the impressions column (highest to lowest). Save this keyword list. These are the keywords that you should continue to optimize for. After all, you are already ranking highly for them.
- Try to prioritize the higher impression keywords, while also considering the average CTR.
- To improve your rankings for any of these keywords, make sure your primary keywords are included in your page’s title tag and h1 tag. Any secondary keywords should be integrated into relevant page copy as either new or existing h2 or h3 tags, body copy, or relevant image alt text.
Next, find your low hanging fruit keywords.
To do this, conduct the same workflow from above (steps 1 through 5). The only difference here is that you should filter the average position column to values 11 through 20. These are the keywords that you are currently ranking for on page 2 of Google. They are your low hanging fruit keywords since they are great opportunities. With a bit of a boost, you can get them onto page 1.
Create and use filters in the remaining tabs of your spreadsheet to further analyze your site’s organic performance in terms of:
- Pages: find your top performing and underperforming pages in terms of clicks, impressions, average CTR and average position.
- Countries: find the countries that are brining you the most traffic from Google, as well as any countries that may need improvement.
- Devices: does your site need improvement in terms of desktop, mobile or tablet organic traffic?
- Search appearance: are you receiving any organic search traffic from search appearance enhancements like rich snippets? We will talk more about enhancements in a later section.
Now that you know how to use Google Search Console’s performance report to help optimize your site’s on-page SEO, let’s move on to checking your site’s page experience.
5. Check Your Site’s Page Experience
In this step you are going to check the page experience signals of your site. These are Google ranking factors that are made up of:
- Core Web Vitals.
- Mobile Friendliness.
- Use of HTTPS.
- Non-Intrusive Interstitials.
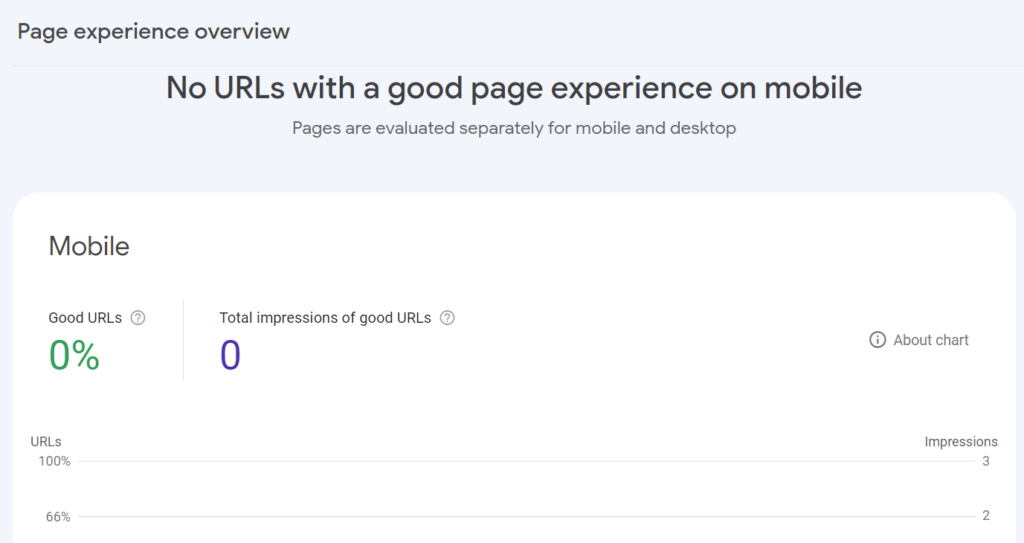
To evaluate your site’s overall page experience in Google Search Console, click on “Page Experience” within the “Experience” tab.
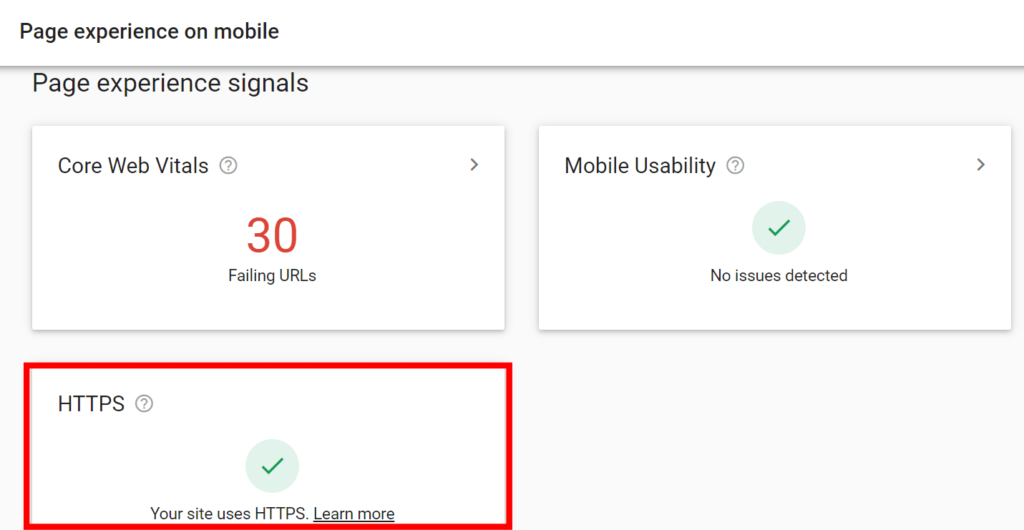
This overview report will show you the percentage of pages on your site that are being characterized as having a “good” page experience, along with their total impressions.
Let’s start by checking your site’s core web vitals. Scroll down in the report and click on “Core Web Vitals”.
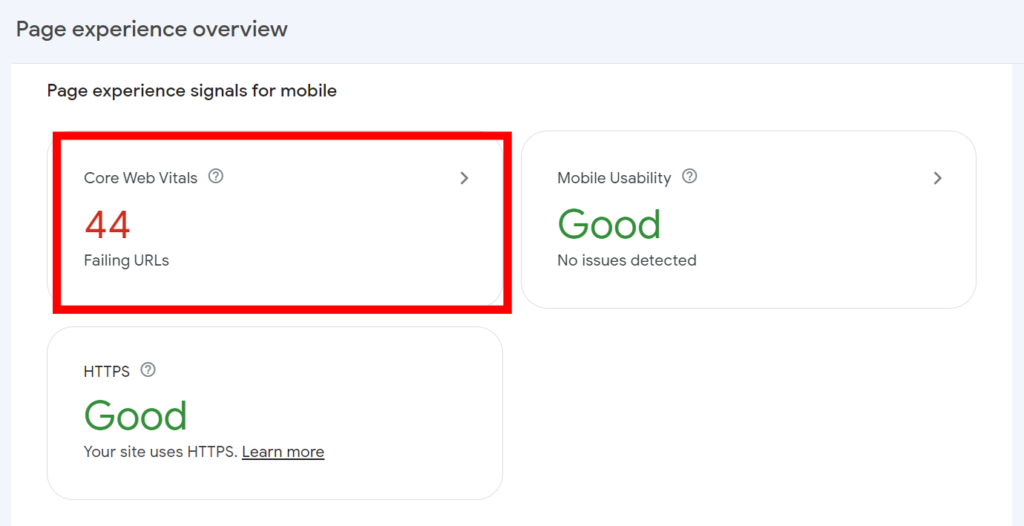
Check Your Site’s Core Web Vitals
Google Search Console’s core web vitals report will show you an overview of how your site is performing with respect to these metrics.
Google’s core web vitals are made up of:
- Largest Contentful Paint (LCP): the perceived load time of a page – how long does the largest element in the user’s viewport take to load?
- First Input Delay (FID): the interactivity of a page – how long it takes for the page to respond to a click?
- Cumulative Layout Shift (CLS): the stability of a page – do unexcepted page shifts occur during the page load?
This report will show you an overview of how your site’s core web vitals are performing on mobile devices. The data comes from the Chrome User Experience report (CrUX) for your site. The CrUX uses real world field data, which comes from the Chrome browser from users that visited your site.
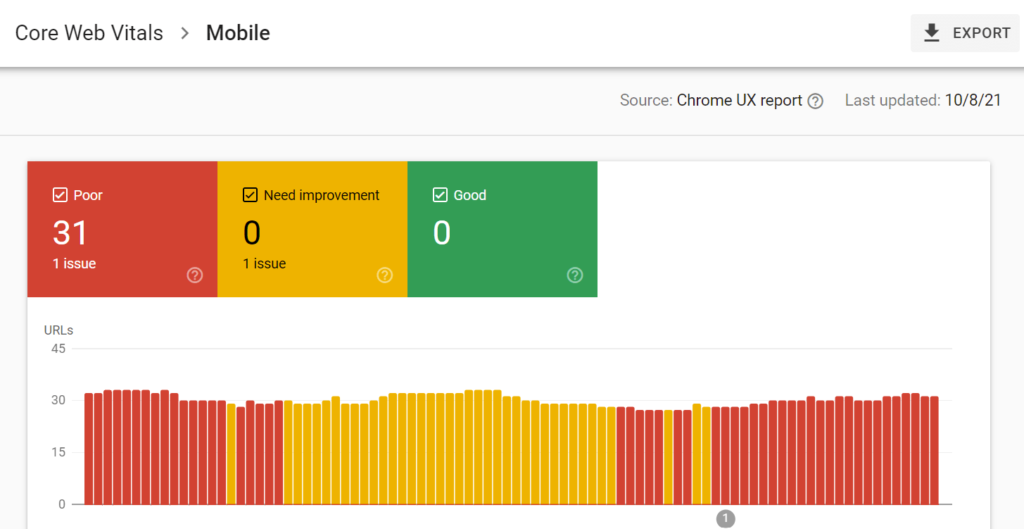
Scroll down to see how Google Search Console is grouping your pages in terms of poor, needs improvement, or good with regards to the core web vitals.
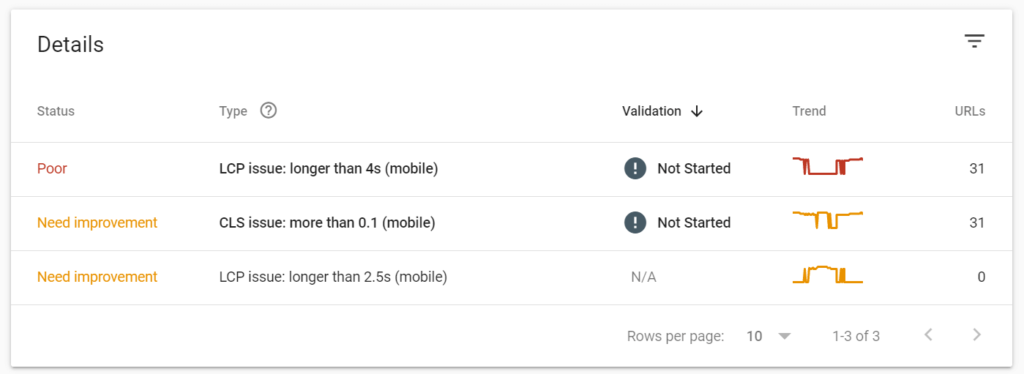
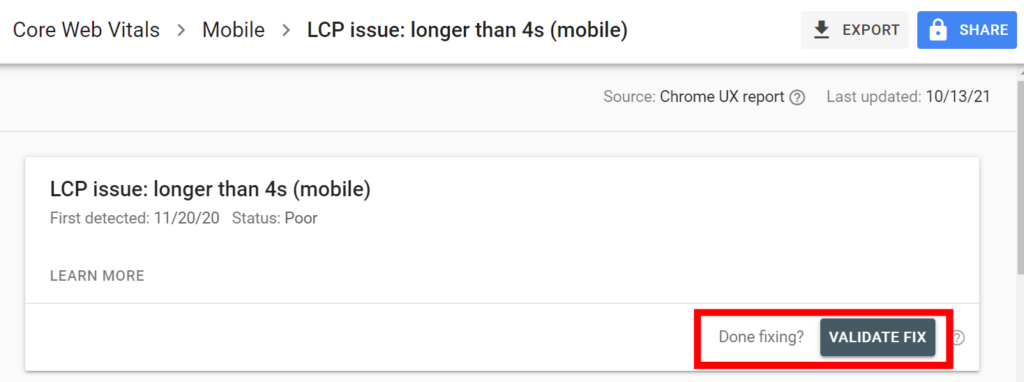
Use the following workflow for fixing any pages on your site with any core web vital issues:
- Start with pages that are being categorizes as poor.
- Click on the specific status grouping in the “Details” section.
- Scroll down and use the “Examples” section to see the specific pages on your site that are being grouped into that status type.
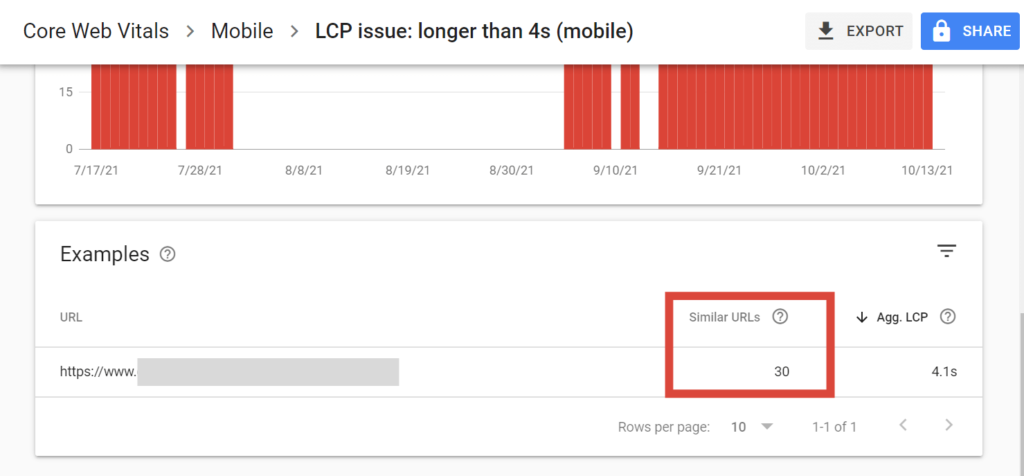
- Click on any of the example URLs listed to see all the similar URLs that are sharing the same issue(s).
- Use Google’s Page Speed Insights, which can be accessed from the report to help diagnose and fix the specific core web vital problem.
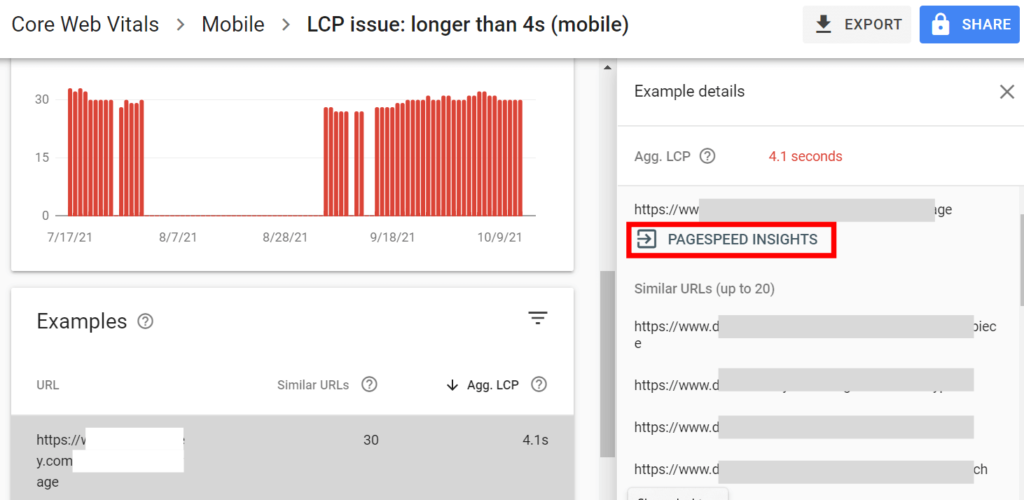
- Once you figure out how to resolve the issue, start by fixing your most important pages.
- Once you are done fixing all of your “poor” pages, move onto pages that need improvement.
- Make sure to validate the fix(es) in Google Search Console once you are done.
If your site doesn’t receive enough traffic, you unfortunately won’t see anything in your Google Search Console page experience report.
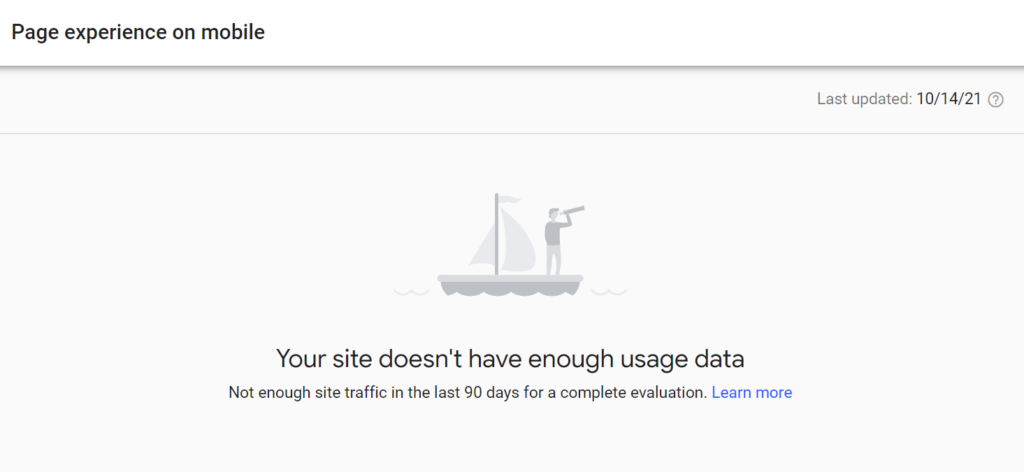
In this case you will have to use Google’s Page Speed Insights to manually check each of your site’s pages. Start with your site’s most important pages and work your way down.
Let’s move on to the next Google page experience ranking factor, mobile friendliness.
Check Your Site’s Mobile Usability
Google primarily uses it’s smartphone crawler (Googlebot smartphone) to crawl and index pages on the web. Therefore, you need to ensure that your site is mobile friendly for both users and search engine bots, as it is important to be able to rank highly in Google search.
To check your site’s mobile usability, click on “Mobile Usability” in the “Experience” tab of Google Search Console.
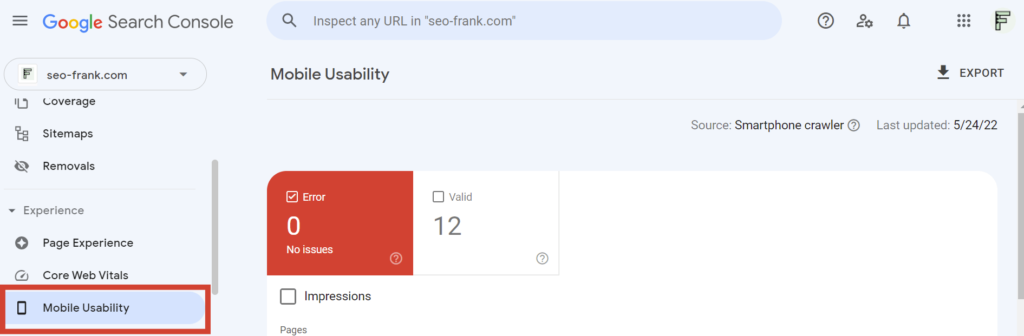
Google Search Console will show you the pages on your site that are being categorized as non-mobile friendly (error), as well as mobile friendly (valid). Scroll down to the details section of the report to see the groupings of pages for each status type.
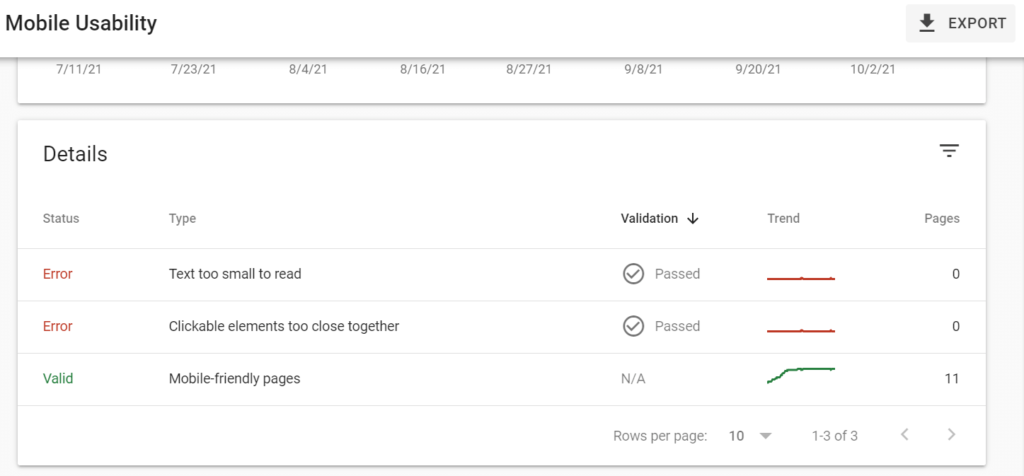
Use a similar workflow to the one we went through for your core web vital issues:
- Start with any status groupings that are being listed as an error in terms of mobile usability.
- Google Search Console will show you a list of the specific pages in the grouping.
- Click on a specific page in the list and Google Search Console will allow you to test the live page in Google’s Mobile Friendly test.
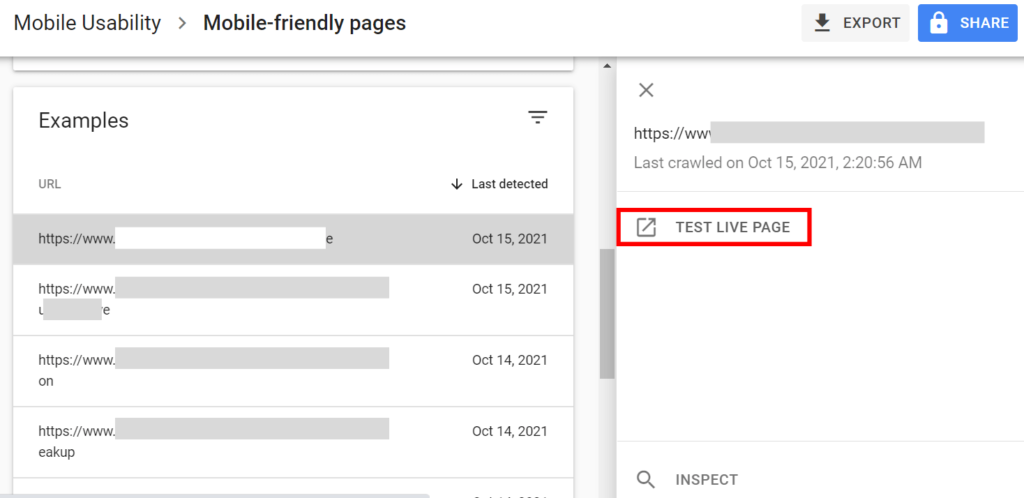
- The test will help you diagnose the issue, and provide tips on how you can fix it.
- Once you have figured out the issue(s), start by fixing your site’s most important pages. Then move down the list to less important pages.
- Once you have fixed the issue(s), make sure to validate the fix(es).
Let’s move on to the next page experience signal.
Does Your Site Use The HTTPS Protocol?
In order to instill confidence in user’s sharing personal information such as email addresses or credit cards on your site, you want to make sure your site uses the https, or secured protocol.
To do this properly, your site needs a valid SSL certificate and all the http versions of your pages should be redirected to the https versions.
To check if your site is using the https protocol, look for the validation in Google Search Console within the “Page Experience” section under the “Experience” tab.
If your site is not using the https protocol, you should consider changing to the secured version. You can even do this for free using a Let’s Encrypt SSL certificate.
Make sure to follow Google’s guidelines on setting up https for your site if you need to do so.
Lastly, let’s make sure your site isn’t using any intrusive interstitials, which can negatively impact your page experience.
Is Your Site Using Intrusive Interstitials?
An intrusive interstitial is any pop-up that is hard to dismiss, and covers a large area of the user’s viewport.
Google is cracking down on this and considers it a negative page experience signal, which can affect your search engine rankings.
If you use any pop-ups on your site, make sure they follow the following guidelines:
- They are easy to dismiss, and don’t cover a large area of the user’s viewport (especially on mobile devices).
- Try not to use pop-up advertisements, as this creates a negative user experience.
- Cookie notifications, or age verification pop-ups are ok.
User’s don’t like annoying pop-ups, and therefore neither does Google. Make sure that your site isn’t using any intrusive interstitials as described above.
Now that we have completed checking all of your site’s page experience signals, let’s move onto the next part of the audit.
6. Check Your Site’s Structured Data
Structured data, or schema, is code that you can add to the HTML of your pages.
Structured data can benefit your site in the following ways:
- It helps give Google additional information and context about what your pages are about.
- It allows your pages to be eligible for rich results in the SERPs, which can help increase your page’s click through rate.
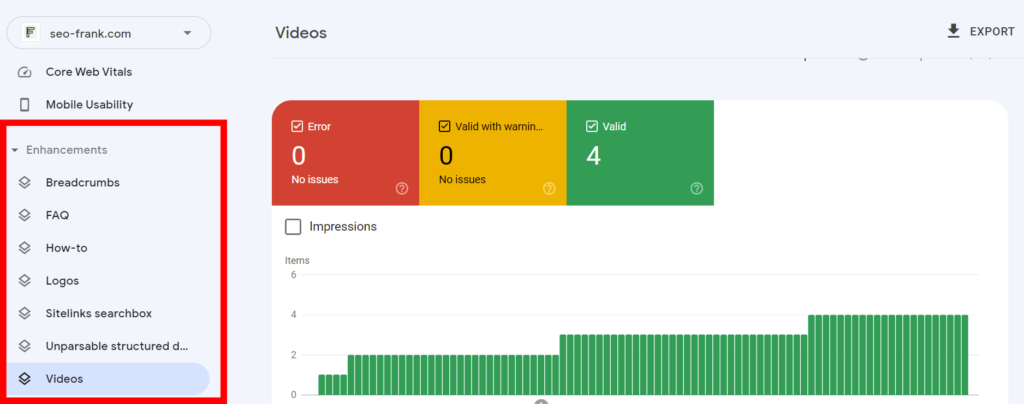
If you have any structured data that has been detected by Google, you will see it show up under the “Enhancements” tab in Google Search Console.
The enhancements report(s) will show you any errors, warnings or valid structured data that Google has detected on your site over time.
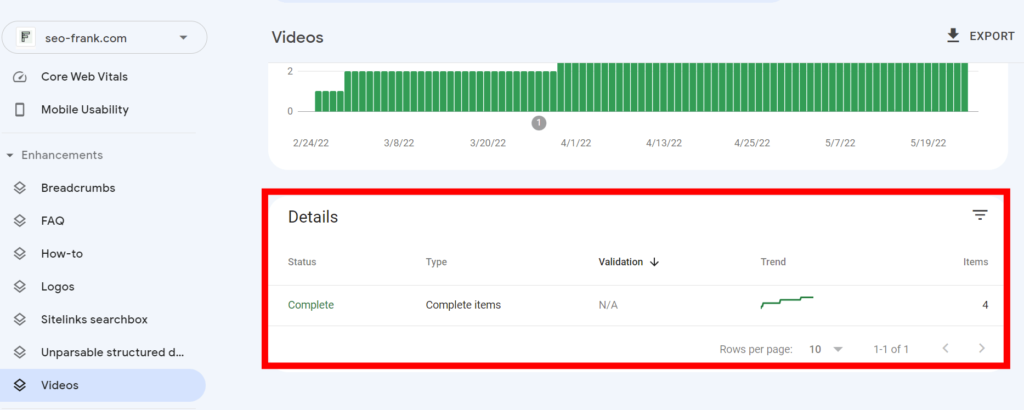
Scroll down to the details section and Google Search Console will show you page groupings on your site for each status type.
Use the same workflow that we covered in previous sections for fixing any errors and warnings shown in the report. Start with any errors, and then move on to the warnings. Prioritize fixing your site’s most important pages.
Once you have fixed the issue(s), use Google’s Rich Results Test to confirm the fixes and to see if those pages are now eligible for rich results within Google’s SERPs.
Don’t forget to also validate the fixes in the enhancements report in Google Search Console, once they have been completed and confirmed.
If Google Search Console isn’t showing any structured data within the enhancements section, this means you probably don’t have any implemented on your site.
In order to add structured data to pages on your site:
- Determine the type(s) of structured data that are applicable to your site. There are many different types, so you will have to determine which ones fit your specific goals and page types.
- Once you determine the specific type(s) you want to add, I recommend using Merkle’s Schema Markup Generator to help generate the preferred JSON-LD markup code required for each structured data type that you want to implement.
- Add the generated code from the tool to the HTML head or body sections of applicable pages, depending on your content management system.
- Make sure to use Google’s Rich Results Test to confirm the proper implementation of the structured data for each page.
That’s it for the structured data audit. Let’s move on.
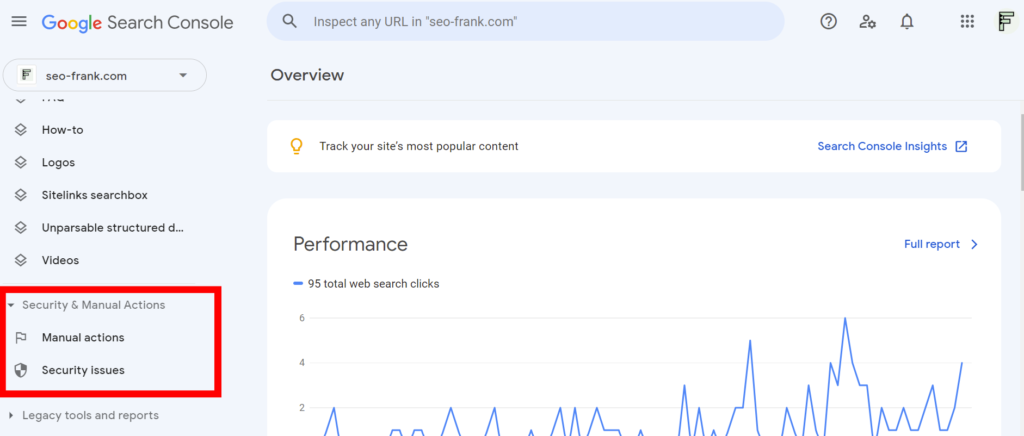
7. Check For Security Issues & Manual Penalties
To check for any security issues or manual penalties that may be affecting your site, use the “Security & Manual Actions” tab in Google Search Console.
Let’s start with the manual actions report.
Manual Actions
Manual actions refer to manual penalties that can be imposed on a site by Google.
The penalty will most likely negatively impact rankings in Google. In severe cases Google can remove specific pages, or even an entire site from it’s index.
To avoid any manual penalties, make sure you aren’t engaging in any black hat SEO tactics that goes against Google’s search webmaster guidelines, and you won’t have to worry about this.
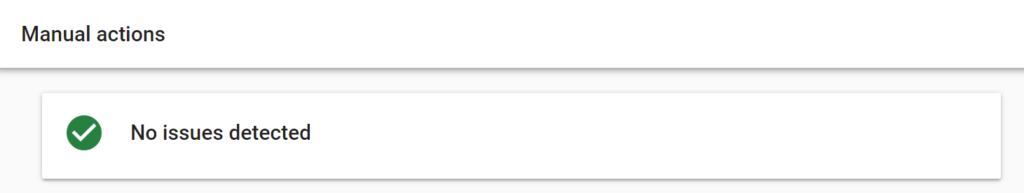
Hopefully you see the above screen shot in your manual actions report.
Next, let’s look at the security issues report.
Security Issues
The security issues report in Google Search Console is Google’s way of notifying you of any detected hacks or malicious activity on your site.
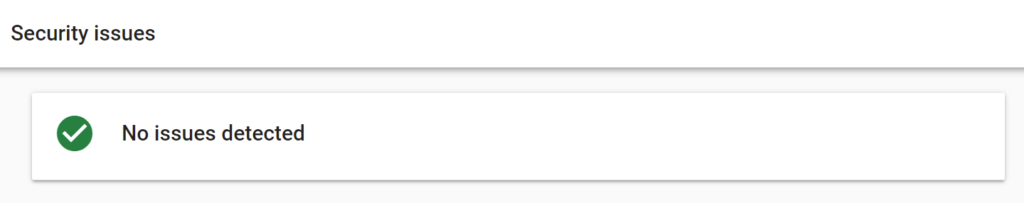
If you see the above validation in your report, you are golden!
If you notice any severe traffic drops on your site, make sure to check both the manual actions and security issues reports to make sure that these aren’t the culprits.
Let’s move on to the last step of the audit.
8. Check Your Site’s Backlinks & Internal Linking
The last part in the Google Search Console SEO audit is regarding your site’s backlinks and internal linking.
Let’s start with the backlinks report.
Backlinks Report
To access the backlinks report in Google Search Console, click “Links” in the navigation menu.
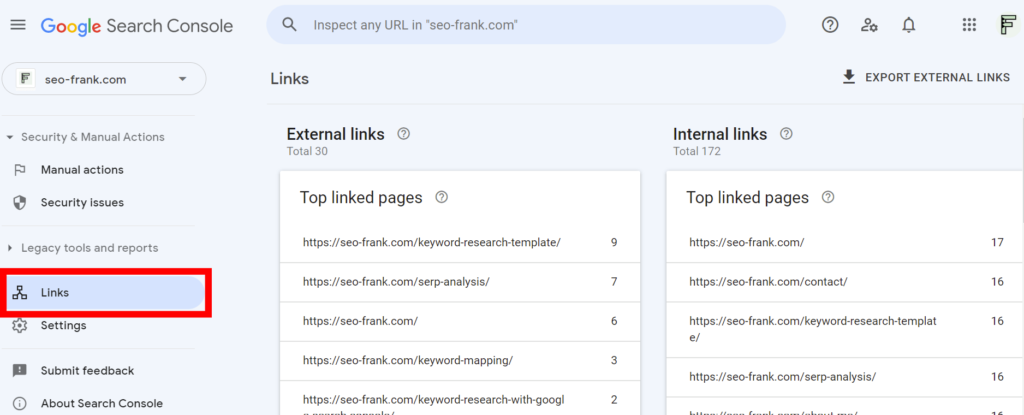
This report shows the links pointing to your site from external domains that have been detected by Google.
Look under the “External Links” column for your site’s:
- Top linked pages: this section shows the pages on your site with backlinks.
- Top linking sites: this section shows the external domains that are backlinking to your site.
- Top linking text: this section shows the anchor text, or clickable text, being used in the backlinks.
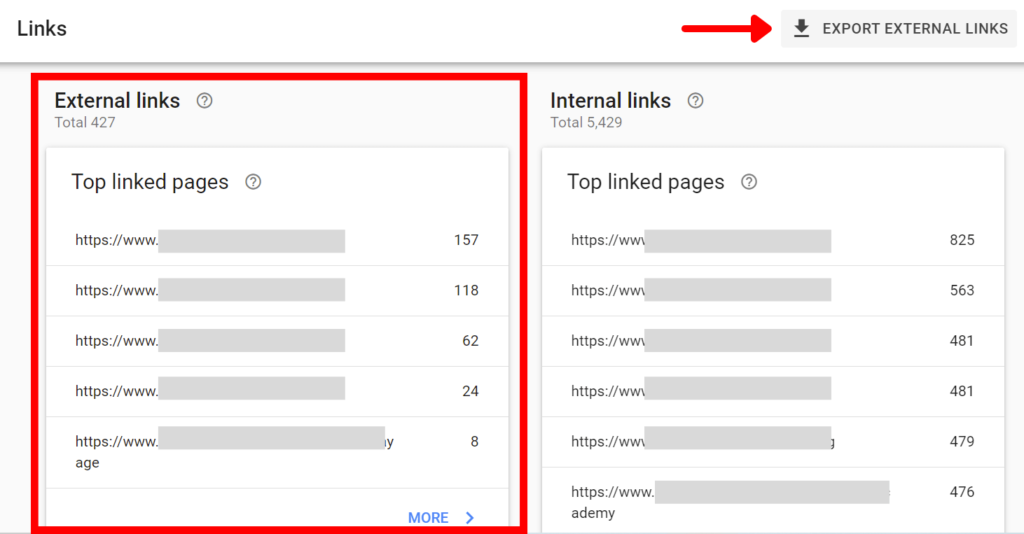
I recommend exporting the external links report as a Google Sheet or Excel file to help your analysis of them. Use the “Export External Links” button located in the top right hand corner of the report.
Once you export the file to a spreadsheet, you are going to want to go through the list and flag any backlinks that appear to be:
- Spammy: This could be a spammy or unfamiliar domain name or page, or the use of anchor text could be spammy.
- Outside of your site’s niche: This won’t necessarily be an error or a concern, but make sure you flag any of these backlinks and ask yourself why you may have received these particular backlinks.
- Purchased: Paying for backlinks is against Google’s guidelines, and is considered to be a black hat link building tactic.
After you flag these types of backlinks, you are going to want to do the following:
- Do nothing: Google has gotten good at ignoring spammy backlinks, and unless you have been engaging in black hat link building techniques, you don’t need to worry about spammy, low quality backlinks. Google will likely filter these links out of their algorithm automatically.
- Outreach: Reach out to the webmasters of any flagged backlinks that you believe may get you a manual penalty in the future, and ask for them to be removed. Keep in mind that this can be very time consuming. In most cases you won’t get a response. If this fails, move on to step 3.
- Disavow: If you are concerned you may receive a manual penalty from black hat link building and weren’t able to get these backlinks removed in the previous step, consider submitting these specific links to Google’s disavow tool.
Only resort to using the disavow tool in extreme circumstances. This is an advanced SEO tactic and more harm than good can come from using this tool if you aren’t careful.
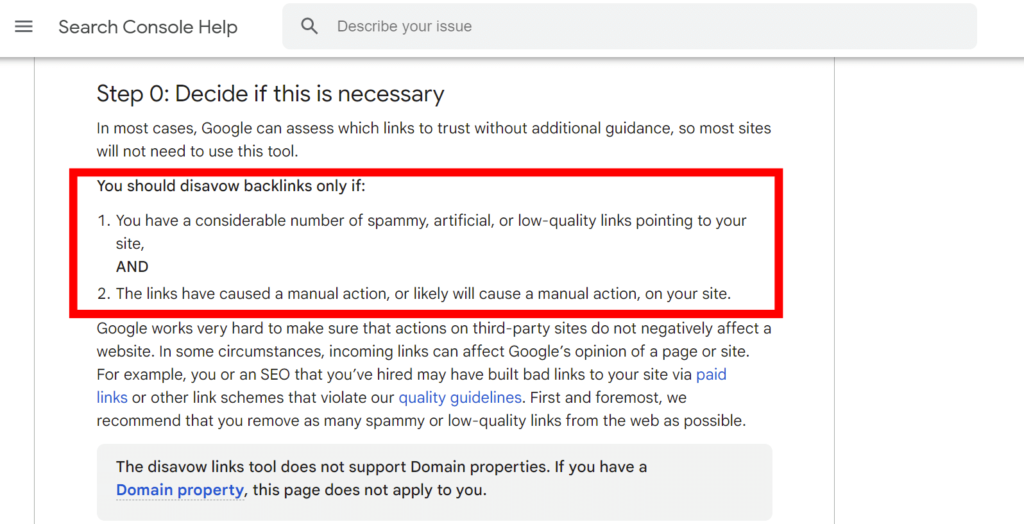
Google themselves have confirmed that you should only disavow backlinks if:
- You have a considerable amount of spammy, low quality backlinks, AND
- You believe you will receive a manual penalty from these backlinks if you are not able to remove them.
Now that you know how to check your site’s backlink profile in Google Search Console, let’s move on to checking your site’s internal linking.
Internal Links Report
The internal links report in Google Search Console will show you your site’s top internally linked pages.
Located in the “Links” section of Google Search Console, the “Internal links” column will show you details on the internal links being used on your site.
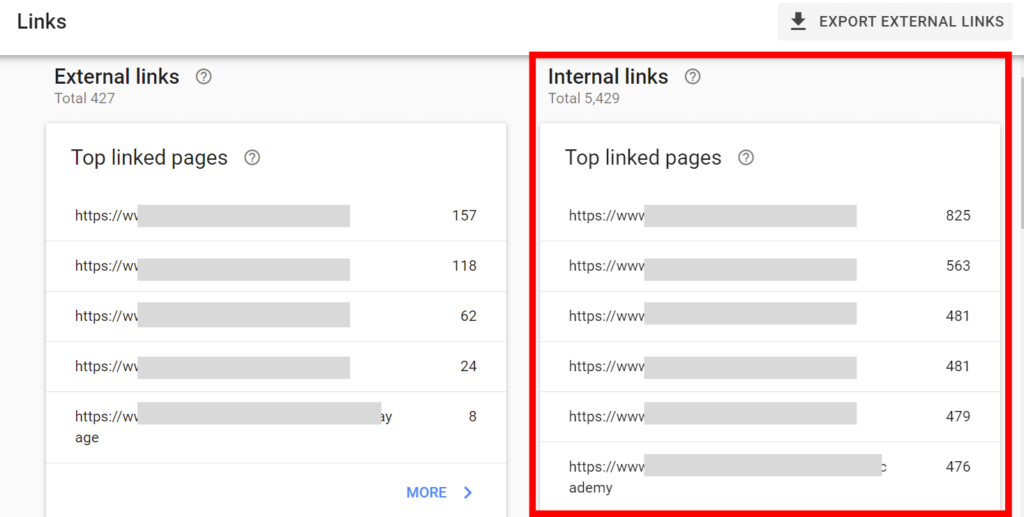
Scroll down and click “More” to see the entire list. This way you can export the report as a spreadsheet using the “Export” button.
Typically, the more important a page is, the more internal links it should have pointing to it.
Keeping this in mind, take a look at your site’s internal linking report and check for the following:
- Are your top linked pages your most important pages?
- If you find any important pages that have fewer internal links than you would like, add some.
- If you find any less important pages that have lots of internal links pointing to them, consider removing some.
Keep in mind that any internal links that you add should be relevant and provide a benefit to the user.
Think of internal links as a way to guide your users to other content on your site that they might find useful. Don’t add internal links that point to non-relevant pages, as this will look unnatural, and won’t provide value to your users.
Try to always use target keywords in the anchor text when using internal links on your site, but never sacrifice readability.
Conclusion
Well, that’s it. You’ve completed an SEO audit of your site using Google Search Console.
As you can see, Google Search Console is a pretty handy SEO auditing tool and can help you improve your site’s organic search performance.
In my opinion, it is one of the most underutilized and underrated free SEO tools available. Sure, there are many other tools available on the market that may provide more features and options, but these obviously come at a cost.
Make sure to check the Google Search Console reports we covered in this post regularly. Aim to perform a full SEO audit at least once every quarter, or after any time you make major changes to your site.
Do you use Google Search Console for your site? Are there other ways you use it to audit your site’s SEO that I missed? Leave a comment below.
Thanks for reading.